
Volume Profile Trading Strategy and Market Profile for Day Trading
2026-11-10
Written by the Obelion team.
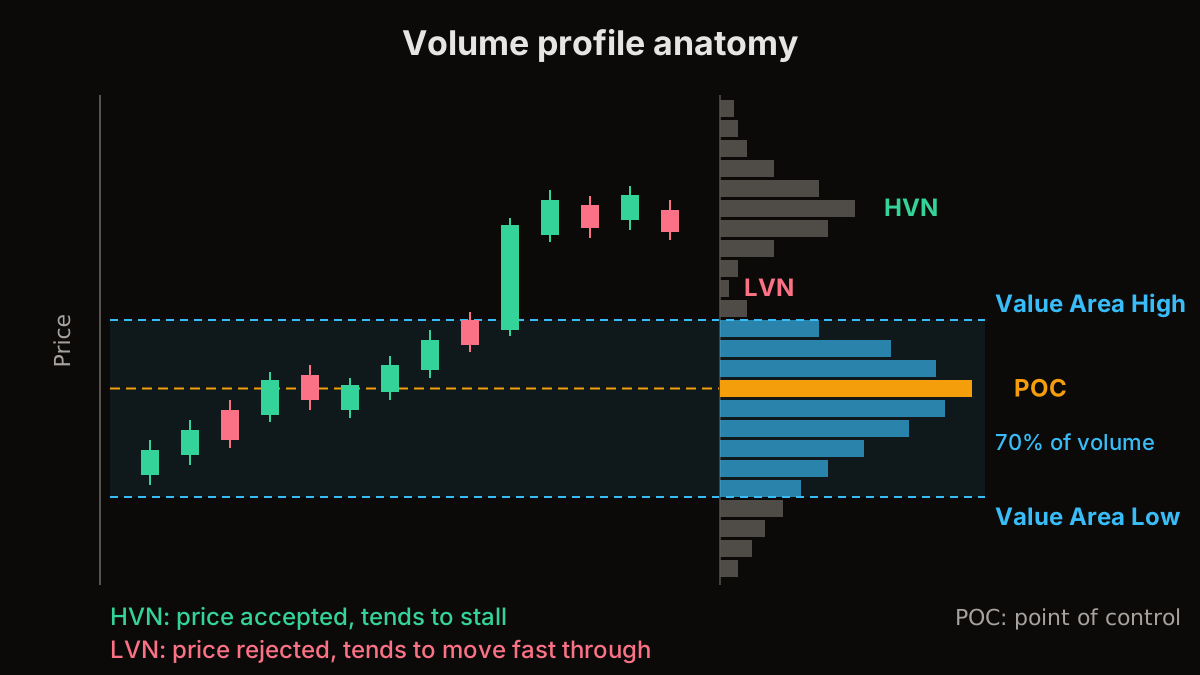
A volume profile shows how much volume traded at each price, instead of at each time. The longest bar is the point of control (POC), the price where the most business got done. The value area is the range that holds about 70% of the volume. Volume profile trading uses those levels to judge where price is accepted and likely to stall, and where it was rejected and may move fast.
The levels that matter
- Point of control. The fairest price of the session. Price often returns to it when the market is balanced.
- Value area high and low. The edges of where most trading happened. A move outside them is the market testing whether a new price is accepted.
- High volume nodes. Prices the market accepted. Price tends to slow down and chop around them.
- Low volume nodes. Prices the market rejected. Price tends to move through them quickly.
A volume profile trading strategy that's easy to follow
The most common setup is the value area rule. If price opens outside yesterday's value area and then trades back inside it, there's a good chance it travels to the other side of the value area. If price breaks out of value and holds, look for continuation and use the low volume node behind it as a reference for your stop.
The second setup is the POC retest. In a balanced session, fades back toward the POC tend to work. In a trending session, the POC from the prior day often flips into support or resistance.
Market profile for day trading
Market profile (TPO) uses time instead of volume: it counts how many time periods, usually 30 minutes each, traded at each price. The shapes tell you what kind of day it is. A D shape is a balanced, two-sided day. A P shape shows buyers pushing up and then building value higher. A b shape is the mirror, with sellers in control. Our volume course covers each shape with examples.
On Obelion, the Monkey Bars deep view on the chart builds a TPO profile per session with the POC and value area marked, and the Volume Profile indicator (Obelisk plan) draws volume at price on any timeframe.
Questions about volume and market profile
What is the difference between volume profile and market profile?
Volume profile measures volume at each price. Market profile measures time spent at each price. They usually agree on the important levels, and when they don't, the difference is worth a look.
What timeframe works best for volume profile?
Session profiles suit day trading. Weekly or composite profiles over several weeks suit swing trading.
Is the point of control support or resistance?
It can be either. It's the price the market agreed on most, so it attracts price in balanced conditions and acts as a pivot in trending ones.
Does volume profile work with gamma levels?
Yes, and they pair well. When a high volume node lines up with a large gamma level, that price tends to matter more.
The volume profile trading strategy guide walks through each setup. You can practice reading profiles on real historical sessions in the Arena.
Not financial advice. Disclaimer